Python Interactive With Vscode

In a previous post we talked about Jupyter notebook. We looked at the support of notebooks from Visual Studio Code and how we could write a notebook almost like a story with interactive code. Continuing on the same line, in today’s post we will be looking at Visual Code Python Interactive and see how it can be used to write Python scripts or quickly test prototypes.
This blog post assumes that Visual Studio Code is installed with its Python extension.
Python in Visual Studio Code
Visual Studio Code ships with support for Python. When we create a new folder, and add a file hello.py with the following content:
1
2
3
4
5
def hello(name):
    print("hello {}".format(name))

name = "kim"
hello(name)
We can hit F5, and select Python File - Debug the currently active Python file in order to run the file by the Python interpretor, or we can add a launch configuration:
1
2
3
4
5
6
7
8
9
10
11
12
13
14
15
{
    // Use IntelliSense to learn about possible attributes.
    // Hover to view descriptions of existing attributes.
    // For more information, visit: https://go.microsoft.com/fwlink/?linkid=830387
    "version": "0.2.0",
    "configurations": [
        {
            "name": "Python: Current File",
            "type": "python",
            "request": "launch",
            "program": "${file}",
            "console": "integratedTerminal"
        }
    ]
}
and selected it from the RUN tab. Each run having a debugger attached, we are able to breakpoint anywhere in the file and do the usual actions we are able to do while debugging, watching variables, stepping into functions, continuing execution, etc…
Python Interactive
On top of native support of Python with file execution, Visual Studio Code also comes with a Python Interactive window which we can select with CMD+P+Windows > Show Pytohn Interactive Window. When the window open, we are prompted to install ipython which is the Python shell used to execute code on the interactive window.
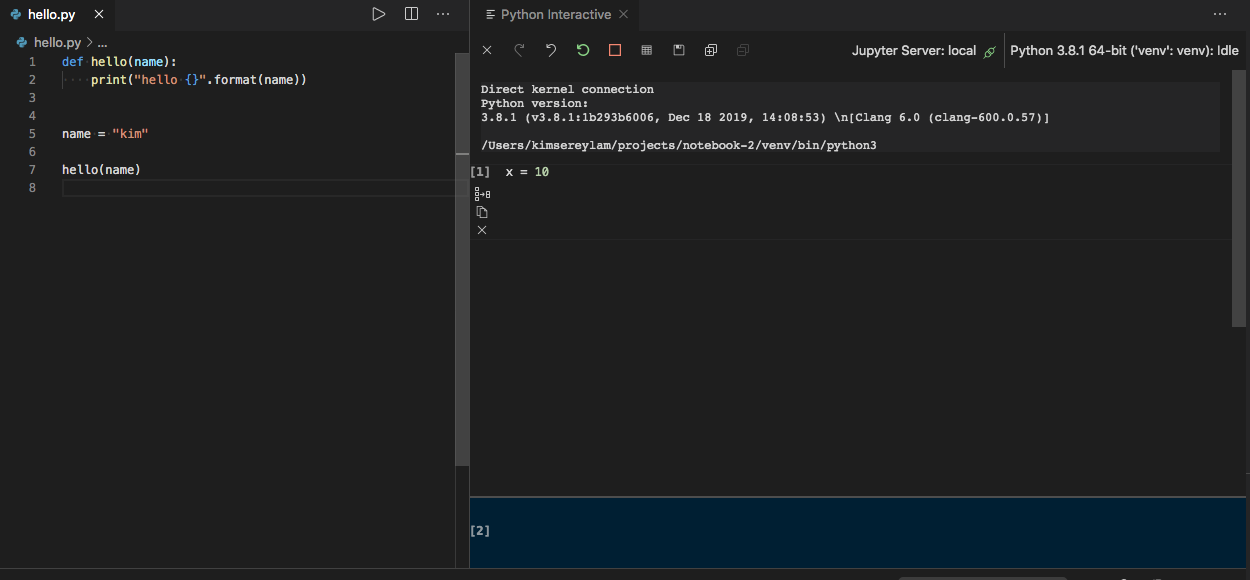
On the interactive window, we can see that we are connected to a local Jupyter server. We can start writing python code in the blue rectangle input and hit SHIFT+ENTER to execute the code.
Just like on a notebook, we are able to organise our code in code cells. This can be achieved using the following notation:
1
# %%
Doing that indicates the beginning of a new code cell.
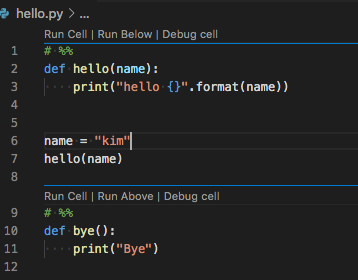
Once we have code cells defined, we are able to use the same keyboard shortcuts as Jupyter notebook to execute specific piece of code. For example the most common shortcuts being:
CMD+ENTERto execute the code cell,SHIFT+ENTERto execute the code cell and create new code cell below.
We can also reset the IPython kernel by hitting the green reset arrow, and clear the interactive window by hitting the cross. This will allow us to restart from fresh executing our code cells.
Being able to have a separation between code cells within the same file makes it easy to write prototype code and execute pieces of interest.
Debugging Cells
Lastly we are able to debug any code cell by clicking Debug cell option on top of the cell.
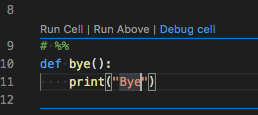
We are then able to breakpoint explore the code execution of the cell.
Conclusion
Today we looked at the Python Interactive Window feature in Visual Studio Code. We started by looking at how the default support of Python files worked and how we could setup launch settings for them to work. We then looked into the Python Interactive and explored the new capabilities it provides us like the specification of code cells and separate execution of code cells. We then completed the post by looking at how to debug a code cell. I hope you liked this post and I see you on the next one!