Debug Python With Pudb
Python comes with a debugger pdb which allows us to debug code right from the terminal. PUDB enhances the debugger by providing a nice GUI directly inside the terminal. In this post we will look into how we can install PUDB and how we can install PUDB and the commands it offers.
Install PUDB
To install PUDB we start by installing it with pip:
1
pip install pudb
Then we can set the PYTHONBREAKPOINT in ~/.bashrc:
1
export PYTHONBREAKPOINT="pudb.set_trace"
Then from your Python code, enter the debugger by using the breakpoint function:
1
2
3
4
5
6
7
8
9
def my_func():
    res=0

    breakpoint()

    res+=1
    return res

my_func()
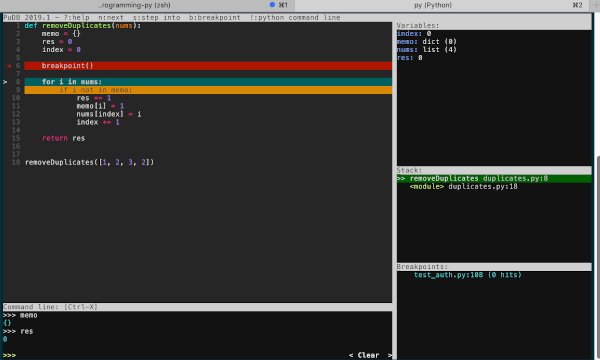
The debugger GUI will then pop up when we run the program. The GUI provides a view on the current place where the debugger breakpoints, the current variables available, the stacktrace and an interactive shell.
Commands
When the GUI pops out, we can interact with it via keyboard commands, here the list of commands:
cContinue the execution of the program,sStep into the function,rGo to the return line of current function,nGo to the next line,uGo one level up the stack,dGo one level down the stack,bSet a breakpoint or remove a breakpoint,CTRL + VFocus on variables tab,CTRL + CFocus on code tab,CTRL + XFocus on shell tab or back to code when on shell tab.
Conclusion
Today we saw how to install PUDB and how to use it. The different commands offered on top of the original commands offers by pdb and the different panels the GUI provides for ease of use. More than inline debugging PUDB provides more advanced features like remote debugging and external shells support. I hope you liked this post and I see you on the next one!