Cloudwatch Alarm On Disk Space

Few weeks ago we saw how to configure CloudWatch to monitor upstream response time from logs. We create a CloudWatch configuration which allowed us to create metrics by parsing the logs and create a dashboard out of it. Building up from there, today we will see how we can monitor disk used space and trigger an alarm when the remaining disk space is critical.
This post will be composed by three parts:
Most of the information can be found on the official AWS Documentation.
Disk Space Metrics
The CloudWatch agent which we installed previously can also be configured to ship default metrics together with logs.
To do that, we need ti add the metrics section in the configuration:
1
2
3
4
5
6
7
8
9
10
11
12
{
    "metrics": {
        "metrics_collected": {
            "disk": {
                "measurement": [ "used_percent" ],
                "metrics_collection_interval": 60,
                "resources": [ "/" ]
            }
        }
    },
    "logs": {...}
}
We specify that we want to measure used_percent at an interval of 60 seconds on the resource "/" which is our main volume mountpoint. To figure our volume, we can use lsblk command:
1
2
3
4
5
$ lsblk

NAME    MAJ:MIN RM SIZE RO TYPE MOUNTPOINT
xvda    202:0    0   8G  0 disk
└─xvda1 202:1    0   8G  0 part /
Once we’ve done that we can then update our configuration and restart the agent to make sure everything is alright:
1
2
3
sudo ./amazon-cloudwatch-agent-ctl -a fetch-config -m ec2 -c file:config.json -s
sudo ./amazon-cloudwatch-agent-ctl -a stop
sudo ./amazon-cloudwatch-agent-ctl -a start
CloudWatch agent should now be setup to push the disk space metrics to CloudWatch.
CloudWatch Metrics
After waiting for a minute, we should now be able to navigate to the metrics section on CloudWatch and find our disk_used_percent metrics:
1
Metrics > CWAgent > Seach xvda1 disk_used_percent
We can then selected it and graph it with an averaging statistic for period of five minutes.
The agent is pushing metrics to CloudWatch every sixty seconds, therefore we will have five datapoints during a period of five minutes - datapoints per minute.
The statistic average option will average the metrics for five minutes therefore averaging between the five datapoints.
Once we are done graphinhg the metrics, we can look at the source and get the json format of the metrics:
1
2
3
4
5
6
{
    "view": "timeSeries",
    "stacked": false,
    "metrics": [[ "CWAgent", "disk_used_percent", "path", "/", "host", "[ip address]", "device", "xvda1", "fstype", "ext4" ]],
    "region": "ap-southeast-1"
}
This specifies that our metrics come from CWAgent for disk_used_percent measurement on mounted path /. The ip address should be the address of your host.
Now that we have the source metrics, we can create an alarm from the alarm section of CloudWatch.
CloudWatch Alarm
Creating an alarm is composed of 4 important steps:
1. Select the metrics
Following this steps, we select the metrics that we created or copy paste the source from defined above.
2. Select the threshold
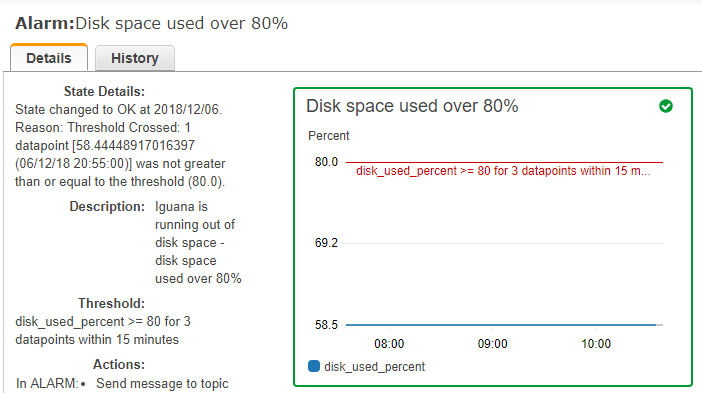
We set a value for the threshold, here we are using disk used in percent therefore we can put >= 80 which would mean the alert would trigger for disk space used over 80%.
3. Set the datapoints for trigger
Then we set the datapoint to for 3 out of 3 datapoints.
The check interval will then be of fifteen minutes - three datapoints of five minutes each, and we will trigger an alert if the three datapoints are over the threshold.
4. Set how missing data are treated
Lastly we treat the missing data as missing.
There are other way to treat missing data, like considering them as breach which would be adequate for different alerts.
The documentation can be found on the official AWS documentation.
And that concludes today’s post, we then endup with a fully configured alarm which triggers when disk space usage is over 80% for 3 consecutive (5 minutes period) datapoints over 15 minutes.
Conclusion
Today we saw how to setup an alarm on CloudWatch triggering on critical disk space used, when it exceeds 80% for fifteen minutes. We started by configuring the CloudWatch agent to collect and push disk space metrics, then we looked at how to graph the metrics and configure the options. Hope you liked this post, see you on the next one!