Debugging Angular App With Chrome Devtools

When developing Angular application, or any sort of frontend application, we ensure that the application works properly by displaying it on the browser. Chrome comes with built-in devtools enhancing greatly our debugging toolkit. In today’s post we will look at the source panel of the devtools and discover the most important functionalities.
Source Panel
On Chrome, we can access the devtools with F12 and pen the Sources panel. A quick way to open the open is to use the CMD+SHIFT+P to open the command menu and start to type source, the option Panel: Show Sources should appear, and select it.
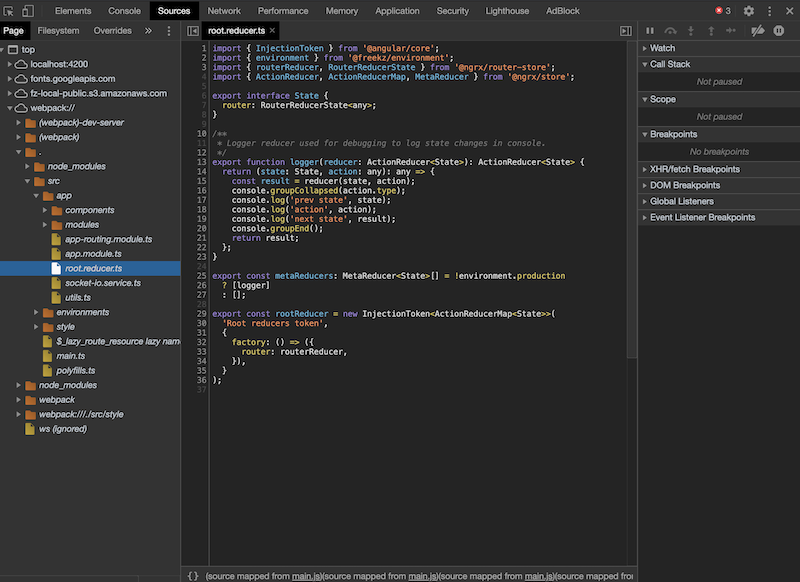
The source panel contains the file tree on the left, the source code tab in the middle, and the debugging tabs on the right. The debugging tabs contain things like the watch variables and breakpoints.
Breakpoint
As our application run, we can set breakpoint in the files coming from the source map under webpack://. In this example, the application is an Angular application being ran with the local webpack-dev-server with source maps that allow us to map back the minified application code to the original codebase. This makes the original codebase available for debugging within the devtool.
Apart from navigating through the file tree, we can use CMD+P to directly open a file.
Placing a breakpoint can be done by clicking on the left side of the line number, or can be done with CMD+B.
Linking Source Code
As we can see, the source tab isn’t just a display of code, it allows editing the source code itself. We can set Chrome to sync between our real source code and the file being displayed on the source tab so that when we make changes from Chrome, it is saved into our source code. This can be extremely useful during debugging to directly fix small bugs quickly from within the browser. To link our repository, we just need to click on Filesystem and add the root folder of our repository. Once this is done we can see a small green badge on our filenames which indicates that our source code is linked.
Console
The other great feature available to us is the Console. The console can be opened by hitting esc or it can be opened with CMD+SHIFT+P > Drawer: Show Console. This will show the console in a drawer at the bottom of the source panel.
Contextual REPL
Waht is great about the console is that it shows logs, warnings and errors, and at the same time provides a contextual REPL.
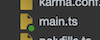
The contextual part plays a big role here, as it allows us to set breakpoints in the application to stop the process, and direclty start exploring our current context from the REPL.
For example if I breakpoint in my codebase where a profile variable is available in the context, I am able to type it in the console and explore the values in it.
Search Highlighting
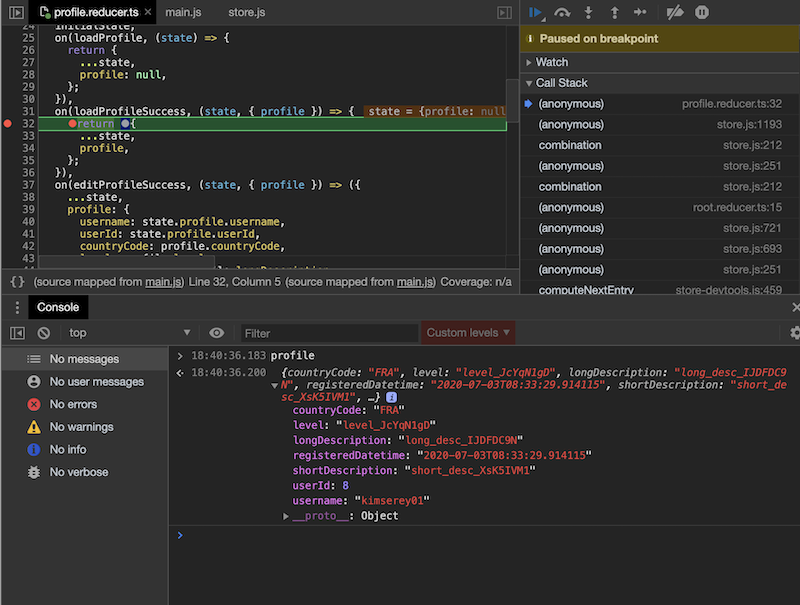
Another great feature about the console REPL is that it highlights when executing search. CMD+F can be used to search. This can be useful when we have debugging logs printed in the console.
Other Options
Global Search
Another way to look for specific code is to access the global search with CMD+SHIFT+P > Show Search Drawer. It allows us to search accross our whole codebase for lines of code.
Network Conditions
And lastly we can also emulate network conditions CMD+SHIFT+P > Drawer: Show Network conditions which allows us to simulate offline, disable cache and slow 3G.
And that concludes today’s post!
Conclusion
In today’s post we looked at the Source panel of the Chrome DevTools. We started by exploring the different windows, we then looked at how we could link our source code to efficiently edit from withing the Chrome browser. We then moved on to look at the console and how we could take advantage of it’s contextual REPL. And lastly we completed this post by looking at the global search and network conditions functionalities. I hope you liked this post and I see you on the next one!