Vegeta Load Test
Dec 21st, 2018 - written by Kimserey with .
Load testing helps catch problems which only appear in high load. A common use case of load testing is to load our API with an amount of request of two or three times higher than the usual load. This will provide confidence in our API ability to handle larger traffic. Today we will look into Vegeta, an open source HTTP load testing tool quick and easy to setup. In this post, I’ll demonstrate how quickly and easily we can load test our API endpoints.
Install Vegeta
Vegeta binaries are available on GitHub Releases. For Windows, all we need to do is to get the Windows executable and unzip it for example under C:\vegeta.
The vegeta.exe is the executable we will be using. To make sure it works as expected, we can display the usage guide by execute vegeta.exe without any arguments.
1
2
3
4
5
6
7
8
9
10
11
12
13
14
15
16
17
$ vegeta.exe

Usage: vegeta [global flags] <command> [command flags]

global flags:
  -cpus int
        Number of CPUs to use (default 4)
  -profile string
        Enable profiling of [cpu, heap]
  -version
        Print version and exit

attack command:
  -body string
        Requests body file
  -cert string
...
The main concept of Vegeta are the targets. A target represents an endpoint which will be load tested - or in Vegeta vocabulary attacked. For example, attacking http://example.com/ would be as followed:
1
echo GET http://example.com | vegeta.exe attack -duration=5s -rate=5
-duration specifies the duration of the test here 5 minutes. -rate specifies the rate of the attack in requests per seconds here we are sending 5 requests per seconds. By default, Vegeta reads from stdin therefore here we pipe directly the example.com target composed by a HTTP method GET and a URL.
Setup Targets
Apart from reading from stdin, Vegeta also can accept a file containing all targets. For example if we wanted to attack our API with multiple endpoints, we would create a targets file targets.txt:
1
2
3
GET http://myapp/users
GET http://myapp/users/1
GET http://myapp/users/2
And run Vegeta:
1
vegeta.exe attack -duration=5s -rate=5 -targets=targets.txt
Vegeta also allows us to define headers using [header name]: [header value]and body using @[file]:
1
2
3
POST http://myapp/users
Content-Type: application/json
@newuser.json
With the newuser.json file being the body of the request:
1
2
3
{
  "name": "kim"
}
Using the targets file, we can then load test all endpoints on our application with predefined requests.
Generate Reports
Every load test executed collect data which can be saved in an output file using the -output parameter.
1
vegeta.exe attack -duration=5s -rate=5 -targets=targets.txt -output=results.bin
This will generate a results.bin file which can be used to generate a response time plot and a report.
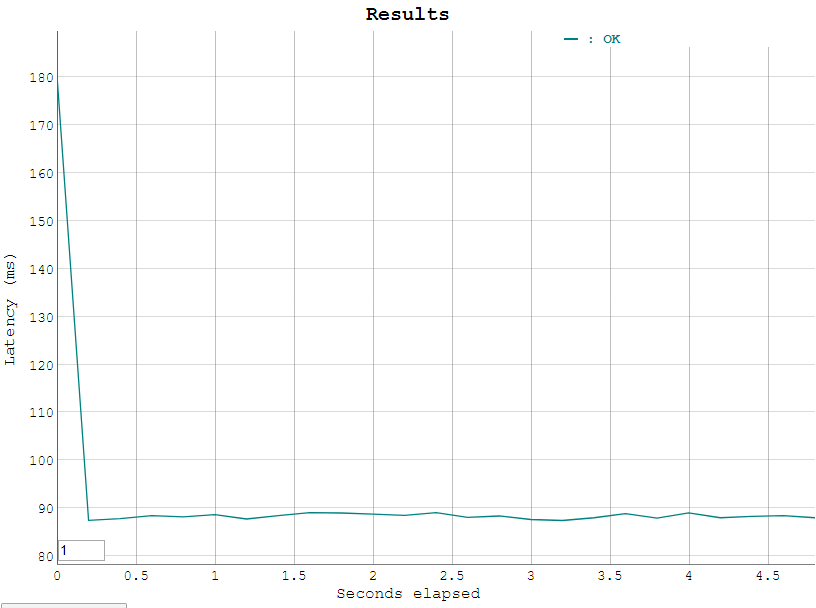
To generate a HTML plot, we use the command vegeta.exe plot and pipe it into a file:
1
vegeta.exe plot -title=Results results.bin > results-plot.html
We can then open the plot in browser and see the results:
Lastly we can also generate a text report out of the data with vegeta.exe report with a -type specifying the type of report we want to extract, the default one being text:
1
2
3
4
5
6
7
8
9
vegeta.exe report results.bin

Requests      [total, rate]            25, 5.21
Duration      [total, attack, wait]    4.8881955s, 4.8001956s, 87.9999ms
Latencies     [mean, 50, 95, 99, max]  91.981328ms, 88.3716ms, 111.89305ms, 180.3523ms, 180.3523ms
Bytes In      [total, mean]            31750, 1270.00
Bytes Out     [total, mean]            0, 0.00
Success       [ratio]                  100.00%
Status Codes  [code:count]             200:25
We can also get the same overall report in json with -type=json:
1
2
3
4
5
6
7
vegeta.exe report --type=hist[80ms,85ms,90ms,100ms] results.bin

Bucket           #   %       Histogram
[80ms,   85ms]   0   0.00%
[85ms,   90ms]   24  96.00%  ########################################################################
[90ms,   100ms]  0   0.00%
[100ms,  +Inf]   1   4.00%   ###
And we can also get histogram with defined buckets with -type=hist[buckets]:
1
2
3
4
5
6
7
vegeta.exe report -type=hist[80ms,85ms,90ms,100ms] results.bin

Bucket           #   %       Histogram
[80ms,   85ms]   0   0.00%
[85ms,   90ms]   24  96.00%  ########################################################################
[90ms,   100ms]  0   0.00%
[100ms,  +Inf]   1   4.00%   ###
Conclusion
Today we saw how to use Vegeta to load test endpoints. We saw how easily we could setup targets endpoint by defining a text file specifying the targets. We also saw how json body and headers could be specify for the endpoints. Lastly we saw how to generate reports and the different kind of reports. Hope you liked this post, see you next time!